 Penguins/NHL
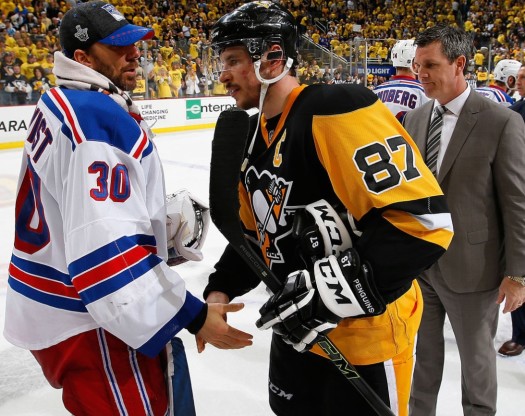
![]()
Penguins By the Numbers
One of the biggest story lines coming into Round 1 between the Penguins – Rangers was the major advantage the Penguins’ had when it came to just about every advanced stat and it was the backbone of why every data driven person was predicting the Penguins to make quick work of the Rangers in the series.
The series played out quite funny. While it was a quick series, the data didn’t back much up.
5 v 5, New York finished the series with a shot attempt for percentage of 55%, the Penguins 45%, and at least statistically were the superior possession team. According to War-on-Ice, the Rangers were also +22 in scoring chances, 116-94. New York also won 55% of their faceoffs 5 v 5 in the series.
Only three Penguins were over 50% at even strength.
Kris Letang – 52 CF%
Patric Hornqvist – 51 CF%
Conor Sheary – 51 CF%
Individually you had some of the Penguins key depth contributors in the series be possession nightmares at even strength.
Forwards
Matt Cullen – 34%
Bryan Rust – 38%
Tom Kuhnhackl – 32%
On the blueline, the Penguins third pairing was often hemmed in their own end. Ben Lovejoy was 36%, Ian Cole 40%.
We’re the Rangers unlucky? Maybe you can make an argument in Game 1. Basically the advanced stats meant nothing in this series in leading to success for the Rangers and when you get the type of .874 save percentage that the Rangers got, it would not have matter if the Rangers possession numbers were 65-35.
The possession numbers also don’t tell the story at all about performances for particular players in the series.
Matt Cullen who scored the game winning goal in Game 3, assisted on the Penguins’ game winning goal in Game 5, then scored a back breaking goal to put the Penguins up 4-2 in the second period of Game 5, was sensational in clutch moments.
Bryan Rust with a two goal game in Game 5 is the talk of the town today. No one gives a damn that he was under 40% in SAT%.
Tom Kuhnhackl who was on the ice for 34 shot attempts and a whopping 72 against, scored a big shorthanded goal in Game 1 and was solid on the penalty kill and with his wall play at even strength.
Maybe in Round 2 the poor possession numbers among depth players and third pairing D come back to burn the Penguins, it’s certainly a possibility, but in Round 1 it didn’t matter.
7-11 11 Penguins scored in the series with 7 players having at least 2 goals:
Sidney Crosby – 3 Goals
Phil Kessel – 3 Goals
Patric Hornqvist – 3 Goals
Evgeni Malkin: 2 Goals
Matt Cullen: 2 Goals
Bryan Rust: 2 Goals
Conor Sheary: 2 Goals
5: Nick Bonino, Sidney Crosby, Evgeni Malkin each led the Penguins with 5 assists in the series
15: Sidney Crosby (8 points) and Evgeni Malkin (7 points) combined for at least 15 points in a series for the first time since the two combined for 20 points vs the Islanders in Round 1 during the 2013 playoffs.
.934 > .874: [hide] Penguins save team percentage (.934), Rangers team save percentage (.874)
PP/PK Percentage: Pittsburgh 127.6% | New York 72.4%
Goal Differential: Pittsburgh +11 (21 Goals, 10 Against)
10-7: Penguins Even Strength Goals (10) – New York Even Strength Goals (7)
Hits: NYR 224 – PIT 143
Rookie Murray 3-0
Matt Murray has joined rare company among all-time rookie goalies who get wins in their first 3 career playoff games pic.twitter.com/MH84BECsA2
— StatsCentre (@StatsCentre) April 24, 2016
No longer the King?
Lundqvist's GAA not much better than his sv% as he was left to be bombarded by the #Penguins scorers in this series pic.twitter.com/v6ZSTOVMfh
— StatsCentre (@StatsCentre) April 24, 2016
[/hide]
Related posts:
 The Numbers Game: Can Rangers Even Strength Goal Production off-set Penguins superior ability to drive possession?
 Poor puck possession in the 3rd period, penalties from star players doomed Penguins in loss to Stars
Woeful power play and poor defensive play has Pens on verge of first round ouster
Penguins – Devils By the Numbers
Poor puck possession in the 3rd period, penalties from star players doomed Penguins in loss to Stars
Woeful power play and poor defensive play has Pens on verge of first round ouster
Penguins – Devils By the Numbers